echarts中几种渐变方式的具体实现方式
更新时间:2022年11月15日 13:51 点击:1494 作者:iuvc
在echarts 中实现渐变的具体几种方式
在我们日常使用Echarts图表过程中,会遇到一些要求我们的echarts图表能实现颜色渐变,以下几种方式就能满足你的需求。文档参考 ECharts option 文档 。
方式一:
线性渐变:new echarts.graphic.LinearGradient(x,y,x2,y2,offset,boolean)
- x,y,x2,y2,包围框中的百分比,数值范围 0-1;
- offset,类似颜色线性梯度,数值范围 0-1;
- boolean,默认false,若最后参数为true,前四个参数将使用像素位置。
径向渐变:new echarts.graphic.RadialGradient(x,y,r,offset,boolean)
- x,y,代表圆心,数值范围 0-1;
- r,代表半径,数值范围 0-1;
- offset,类似颜色线性梯度,数值范围 0-1;
- boolean,默认false,若最后参数为true,前四个参数将使用像素位置。
采用图片显示:new echarts.graphic.Pattern(imageDom,repeat)
- imageDom,仅支持 HTMLImageElement 和 HTMLCanvasElement形式图片;
- repeat,默认’repeat’,可取值还有’repeat-x’, ‘repeat-y’, or ‘no-repeat’;
代码示例:
// 创建 HTMLImageElement
// HTMLCanvasElement请自行研究去
var imageDom = new Image(); // Image 构造函数
imageDom.src = '/static/img/map_bg.png'; // 图片路径
imageDom.alt = '这是一张图片';

// 应用如下
// color:{
//   image: imageDom, // 支持为 HTMLImageElement, HTMLCanvasElement,不支持路径字符串
//    repeat: 'repeat' // 是否平铺,可以是 'repeat-x', 'repeat-y', 'no-repeat'
// }
方式二:colorStops
线性渐变:colorStops - linear
- type:‘linear’,线性渐变
- x,y,x2,y2,代表包围框中的百分比,数值范围 0-1;
- colorStops,类似颜色线性梯度,数值范围 0-1;
- global,默认false
径向渐变:colorStops - radial
- type:‘radial’,径向渐变
- x,y,代表圆心,数值范围 0-1;
- r,代表半径,数值范围 0-1;
- colorStops,类似颜色线性梯度,数值范围 0-1;
- global,默认false
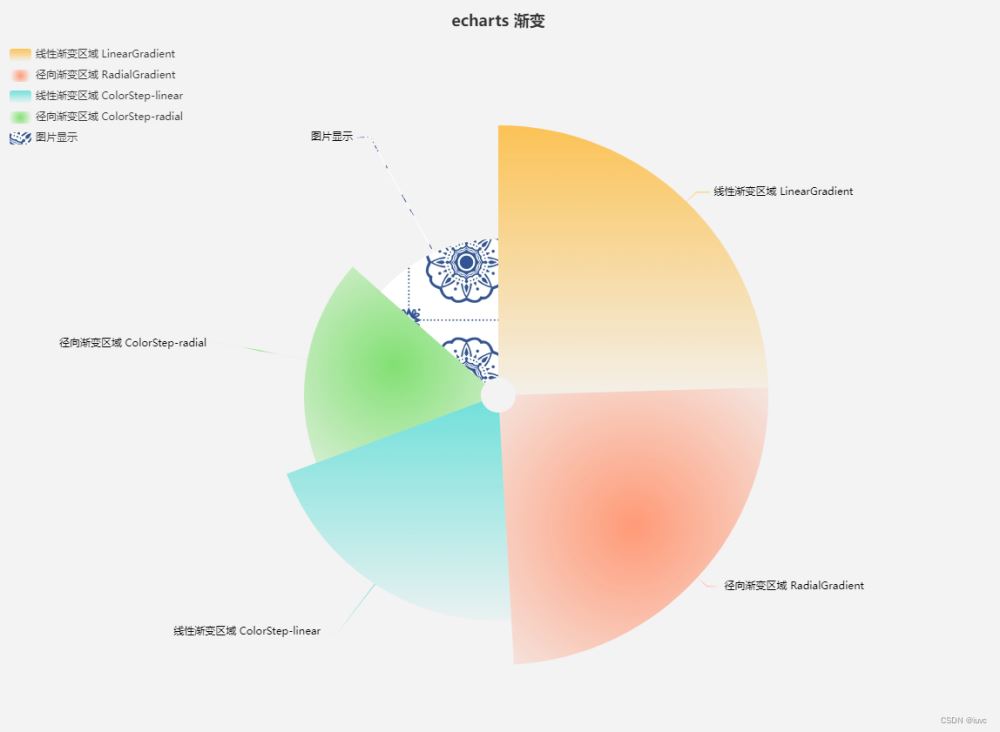
效果图:
代码如下:
var imageDom = new Image(); // Image 构造函数
imageDom.src = 'https://github.com/iuvc/magicJs/blob/main/public/images/issues/blue-white-background.jpg?raw=true';
imageDom.alt = '测试';
option = {
  title: {
    text: 'echarts 渐变',
    left: 'center'
  },
  tooltip: {
    trigger: 'item',
    formatter: '{a} <br/>{b} : {c} ({d}%)'
  },
  legend: {
    top: 40,
    left: 0,
    orient: 'vertical',
    data: [
      '线性渐变区域 LinearGradient',
      '径向渐变区域 RadialGradient',
      '线性渐变区域 ColorStep-linear',
      '径向渐变区域 ColorStep-radial',
      '图片显示'
    ]
  },
  series: [
    {
      name: 'Radius Mode',
      type: 'pie',
      radius: [20, '70%'],
      center: ['50%', '50%'],
      roseType: 'radius',
      itemStyle: {
        borderRadius: 5
      },
      label: {
        show: true
      },
      emphasis: {
        label: {
          show: true
        }
      },
      data: [
        {
          value: 40,
          name: '线性渐变区域 LinearGradient',
          itemStyle: {
            //  线性渐变方式一 ======================================================
            // LinearGradient前四个分参数别代表右,下,左,上,数值0-1
            color: new echarts.graphic.LinearGradient(0, 0, 0, 1, [
              {
                offset: 0,
                color: 'rgba(255,174,19,0.7)'
              },
              {
                offset: 1,
                color: 'rgba(255,174,19,0.05)'
              }
            ])
          }
        },
        {
          value: 40,
          name: '径向渐变区域 RadialGradient',
          itemStyle: {
            //  径向渐变方式一 ======================================================
            // RadialGradient前三个分参数别代表圆心(x,y),半径(数值0-1)
            color: new echarts.graphic.RadialGradient(0.5, 0.5, 0.8, [
              {
                offset: 0,
                color: 'rgba(255,154,119,1)'
              },
              {
                offset: 1,
                color: 'rgba(255,154,119,0.05)'
              }
            ])
          }
        },
        {
          value: 33,
          name: '线性渐变区域 ColorStep-linear',
          itemStyle: {
            //  线性渐变方式二 ======================================================
            // x,y,x2,y2数值同LinearGradient前四个参数分别代表右,下,左,上,数值0-1
            color: {
              type: 'linear',
              x: 0,
              y: 0,
              x2: 0,
              y2: 1,
              colorStops: [
                {
                  offset: 0,
                  color: 'rgba(60,216,208,0.7)' // 0% 处的颜色
                },
                {
                  offset: 1,
                  color: 'rgba(60,216,208,0.05)' // 100% 处的颜色
                }
              ],
              global: false // 缺省为 false
            }
          }
        },
        {
          value: 28,
          name: '径向渐变区域 ColorStep-radial',
          itemStyle: {
            //  径向渐变方式二 ======================================================
            // x 0.5 y 0.5 代表圆心,r 代表半径
            color: {
              type: 'radial',
              x: 0.5,
              y: 0.5,
              r: 0.9,
              colorStops: [
                {
                  offset: 0,
                  color: 'rgba(82,216,60, 0.7)' // 0% 处的颜色
                },
                {
                  offset: 1,
                  color: 'rgba(82,216,60, 0.05)' // 100% 处的颜色
                }
              ],
              global: false // 缺省为 false
            }
          }
        },
        {
            value: 22,
            name: '图片显示' ,
            itemStyle: {
            //  图片显示 ======================================================
                color: {
                  image: imageDom, // 支持为 HTMLImageElement, HTMLCanvasElement,不支持路径字符串
                  repeat: 'repeat' // 是否平铺,可以是 'repeat-x', 'repeat-y', 'no-repeat'
                }
            }
        }
      ]
    }
  ]
};
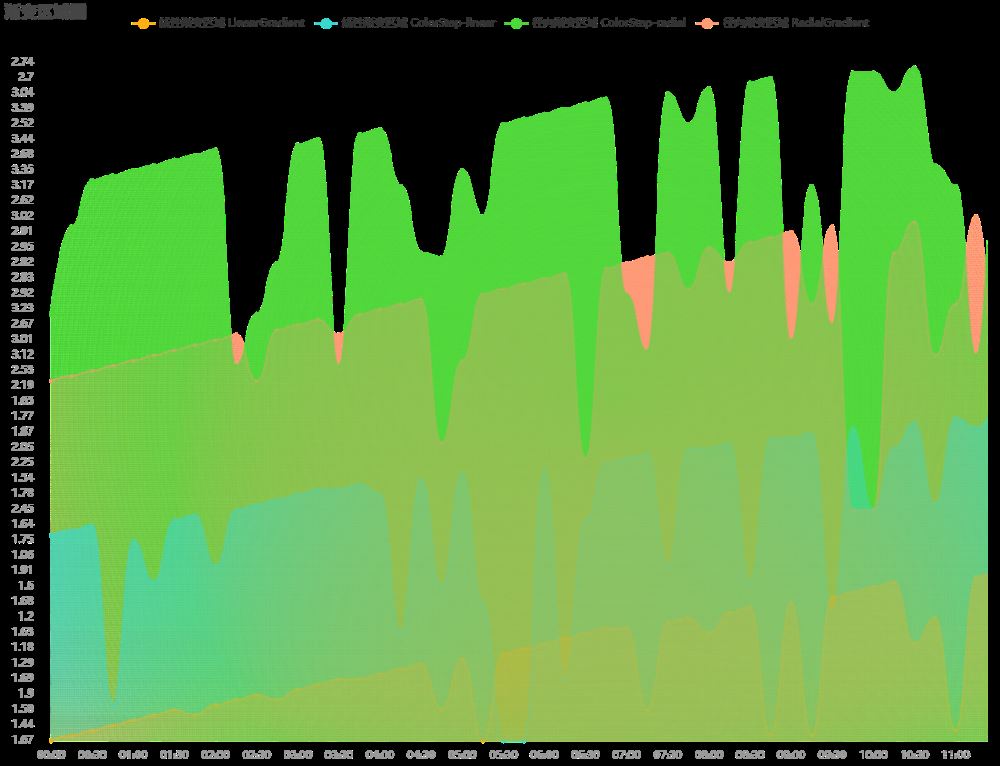
其他示例:
代码如下:
option = {
  title: {
    text: '渐变区域图'
  },
  tooltip: {
    trigger: 'axis',
    axisPointer: {
      type: 'cross',
      label: {
        backgroundColor: '#6a7985'
      }
    }
  },
  legend: {
    top: 15,
    data: [
      '线性渐变区域 LinearGradient',
      '线性渐变区域 ColorStep-linear',
      '径向渐变区域 ColorStep-radial',
      '径向渐变区域 RadialGradient'
    ]
  },
  grid: {
    top: 55,
    left: 45,
    right: 15,
    bottom: 25
  },
  xAxis: [
    {
      type: 'category',
      boundaryGap: true,
      axisLine: {
        show: false,
        onZero: true,
        lineStyle: {
          color: '#999999'
        }
      },
      splitLine: {
        show: false
      },
      axisTick: {
        show: false
      },
      data: [
        '00:00',
        '00:15',
        '00:30',
        '00:45',
        '01:00',
        '01:15',
        '01:30',
        '01:45',
        '02:00',
        '02:15',
        '02:30',
        '02:45',
        '03:00',
        '03:15',
        '03:30',
        '03:45',
        '04:00',
        '04:15',
        '04:30',
        '04:45',
        '05:00',
        '05:15',
        '05:30',
        '05:45',
        '06:00',
        '06:15',
        '06:30',
        '06:45',
        '07:00',
        '07:15',
        '07:30',
        '07:45',
        '08:00',
        '08:15',
        '08:30',
        '08:45',
        '09:00',
        '09:15',
        '09:30',
        '09:45',
        '10:00',
        '10:15',
        '10:30',
        '10:45',
        '11:00',
        '11:15'
      ]
    }
  ],
  yAxis: [
    {
      type: 'category',
      boundaryGap: true,
      axisLine: {
        show: false,
        onZero: true,
        lineStyle: {
          color: '#999999'
        }
      },
      splitLine: {
        show: false
      },
      axisTick: {
        show: false
      }
    }
  ],
  series: [
    {
      name: '线性渐变区域 LinearGradient',
      type: 'line',
      stack: '总量',
      data: [
        1.67, 1.25, 1.02, 1.44, 1.81, 1.13, 1.58, 1.13, 1.56, 1.3, 1.9, 1.3,
        1.55, 1.94, 1.69, 1.69, 1.8, 1.21, 1.29, 1.58, 1.04, 1.67, 1.07, 1.18,
        1.57, 1.05, 1.63, 1.28, 1.28, 1.58, 1.88, 1.2, 1.63, 1.59, 1.43, 1.25,
        1.68, 1.25, 1.12, 1.31, 1.6, 1.62, 1.57, 1.2, 1.02, 1.42, 1.91, 1.97,
        1.32, 1.06, 1.3, 1.22, 1.74, 1.02, 1.75, 1.2
      ],
      areaStyle: {
        color: new echarts.graphic.LinearGradient(0, 0, 0, 1, [
          {
            offset: 0,
            color: 'rgba(255,174,19,0.7)'
          },
          {
            offset: 1,
            color: 'rgba(255,174,19,0.05)'
          }
        ])
      },
      itemStyle: {
        color: 'rgba(255,174,19,.1)'
      },
      lineStyle: {
        color: 'rgba(255,174,19,.1)'
      },
      smooth: true,
      smoothMonotone: 'x',
      symbol: 'circle'
    },
    {
      name: '线性渐变区域 ColorStep-linear',
      type: 'line',
      stack: '总量',
      data: [
        2.31, 2.27, 1.64, 1.56, 1.75, 1.62, 2.18, 2.12, 1.97, 2.45, 2.39, 2.3,
        1.78, 1.82, 1.82, 1.76, 1.78, 1.63, 1.54, 1.6, 1.61, 1.68, 1.67, 1.67,
        2.34, 1.69, 2.18, 2.25, 2.44, 2.4, 1.97, 2.05, 2.05, 2.46, 1.62, 1.66,
        1.66, 1.87, 1.59, 1.99, 2.45, 2.05, 1.53, 2.39, 1.77, 1.99, 2.14, 2.33,
        1.55, 1.87, 1.65, 2.02, 1.68, 2.13, 1.88, 2.19
      ],
      areaStyle: {
        color: {
          type: 'linear',
          x: 0,
          y: 0,
          x2: 0,
          y2: 1,
          colorStops: [
            {
              offset: 0,
              color: 'rgba(60,216,208,0.7)' // 0% 处的颜色
            },
            {
              offset: 1,
              color: 'rgba(60,216,208,0.05)' // 100% 处的颜色
            }
          ],
          global: false // 缺省为 false
        }
      },
      itemStyle: {
        color: 'rgba(60,216,208,.1)'
      },
      lineStyle: {
        color: 'rgba(60,216,208,.1)'
      },
      smooth: true,
      smoothMonotone: 'x',
      symbol: 'circle'
    },
    {
      name: '径向渐变区域 RadialGradient',
      type: 'line',
      stack: '总量',
      label: {
        normal: {
          show: true,
          position: 'top'
        }
      },
      data: [
        2.69, 2.47, 2.53, 3.31, 3.25, 3.12, 2.66, 2.58, 3.01, 3.21, 2.69, 2.72,
        2.67, 3.34, 3.21, 2.79, 3.23, 3.07, 2.84, 2.46, 3.25, 2.92, 2.42, 2.61,
        2.83, 3.29, 2.44, 3.38, 2.82, 2.56, 2.94, 2.42, 2.95, 2.82, 3.18, 2.6,
        2.91, 3.07, 2.57, 2.45, 2.45, 2.94, 2.86, 3.12, 3.07, 3.02, 2.53, 2.64,
        2.97, 2.62, 2.79, 2.68, 3.24, 3.38, 2.67, 3.17
      ],
      areaStyle: {
        color: new echarts.graphic.RadialGradient(0.5, 0.5, 0.8, [
          {
            offset: 0,
            color: 'rgba(255,154,119,.7)'
          },
          {
            offset: 1,
            color: 'rgba(255,154,119,0.05)'
          }
        ])
      },
      itemStyle: {
        color: 'rgba(255,154,119,.1)'
      },
      lineStyle: {
        color: 'rgba(255,154,119,.1)'
      },
      smooth: true,
      smoothMonotone: 'x',
      symbol: 'circle'
    },
    {
      name: '径向渐变区域 ColorStep-radial',
      type: 'line',
      stack: '总量',
      label: {
        normal: {
          show: true,
          position: 'top'
        }
      },
      data: [
        2.79, 2.57, 2.63, 3.41, 3.35, 3.22, 2.76, 2.68, 3.11, 3.31, 2.79, 2.82,
        2.77, 3.44, 3.31, 2.89, 3.33, 3.17, 2.94, 2.56, 3.35, 3.02, 2.52, 2.71,
        2.93, 3.39, 2.54, 3.48, 2.92, 2.66, 3.04, 2.52, 3.05, 2.92, 3.28, 2.7,
        3.01, 3.17, 2.67, 2.55, 2.55, 3.04, 2.96, 3.22, 3.17, 3.12, 2.63, 2.74,
        3.07, 2.72, 2.89, 2.78, 3.34, 3.48, 2.77, 3.27
      ],
      areaStyle: {
        color: {
          type: 'radial',
          x: 0.5,
          y: 0.5,
          r: 0.9,
          colorStops: [
            {
              offset: 0,
              color: 'rgba(82,216,60, 0.7)' // 0% 处的颜色
            },
            {
              offset: 1,
              color: 'rgba(82,216,60, 0.05)' // 100% 处的颜色
            }
          ],
          global: false // 缺省为 false
        }
      },
      itemStyle: {
        color: 'rgba(82,216,60,.1)'
      },
      lineStyle: {
        color: 'rgba(82,216,60,.1)'
      },
      smooth: true,
      smoothMonotone: 'x',
      symbol: 'circle'
    }
  ]
};
总结
到此这篇关于echarts中几种渐变方式的具体实现的文章就介绍到这了,更多相关echarts渐变方式实现内容请搜索猪先飞以前的文章或继续浏览下面的相关文章希望大家以后多多支持猪先飞!
原文出处:https://blog.csdn.net/weixin_42927679/article/details/125170
相关文章
- 这篇文章主要介绍了解决echarts 一条柱状图显示两个值,类似进度条的问题,具有很好的参考价值,希望对大家有所帮助。一起跟随小编过来看看吧...2020-07-20
Illustrator渐变网格工具绘制可爱的卡通小猪教程分享
今天小编在这里就来给Illustrator的这一款软件的使用者们来说一说渐变网格工具绘制可爱的卡通小猪的教程,各位想知道具体制作方法的使用者们,那么下面就快来跟着小编一...2016-09-14- 这篇文章主要介绍了JS实现响应鼠标点击动画渐变弹出层效果代码,具有非常自然流畅的动画过度效果,涉及JavaScript针对鼠标事件的响应及页面元素样式的动态操作相关技巧,需要的朋友可以参考下...2016-03-28
详解在IDEA中将Echarts引入web两种方式(使用js文件和maven的依赖导入)
这篇文章主要介绍了在IDEA中将Echarts引入web两种方式(使用js文件和maven的依赖导入),本文通过图文并茂的形式给大家介绍的非常详细,对大家的学习或工作具有一定的参考借鉴价值,需要的朋友可以参考下...2020-07-11- 这篇文章主要介绍了基于Ionic3实现选项卡切换并重新加载echarts,文中通过示例代码介绍的非常详细,对大家的学习或者工作具有一定的参考学习价值,需要的朋友可以参考下...2020-09-24
- 这篇文章主要介绍了详解Javascript利用echarts画空气质量地图,文中通过示例代码介绍的非常详细,对大家的学习或者工作具有一定的参考学习价值,需要的朋友们下面随着小编来一起学习学习吧...2021-10-11
- 众所周知echarts是一个纯JavaScript的图标库,下面这篇文章主要给大家介绍了关于Echarts实例之树形图表的实现方法,需要的朋友可以参考下...2021-08-06
echarts实现获取datazoom的起始值(包括x轴和y轴)
这篇文章主要介绍了echarts实现获取datazoom的起始值(包括x轴和y轴),具有很好的参考价值,希望对大家有所帮助。一起跟随小编过来看看吧...2020-07-20在echarts中图例legend和坐标系grid实现左右布局实例
这篇文章主要介绍了在echarts中图例legend和坐标系grid实现左右布局实例,具有很好的参考价值,希望对大家有所帮助。一起跟随小编过来看看吧...2020-05-17- PS或者AE中我们在使用渐变工具时,会发现渐变的过渡不均匀,出现明显的波纹,也就是色带(色阶),怎么能很好地优化这个问题呢?(之所以说优化,因为此问题不可能完全解决,只能说能让色...2017-01-22
- 这篇文章主要介绍了JS+CSS实现的漂亮渐变背景特效代码,包含6个渐变效果,涉及JavaScript针对页面元素属性动态操作的相关技巧,需要的朋友可以参考下...2016-03-28
如何使用PHP+jQuery+MySQL实现异步加载ECharts地图数据(附源码下载)
ECharts地图主要用于地理区域数据的可视化,展示不同区域的数据分布信息,通过本文给大家介绍如何使用PHP+jQuery+MySQL实现异步加载ECharts地图数据,需要的朋友参考下吧...2016-02-26- 这篇文章主要为大家详细介绍了vue+echarts实现堆叠柱状图,文中示例代码介绍的非常详细,具有一定的参考价值,感兴趣的小伙伴们可以参考一下...2021-09-05
- 说起“渐变色”,你会想起什么? 当我开始搜索查找这个名词的时候,才发现它实际上是有两种理解或者说是两种形式的:动态渐变和静态渐变。 所谓动态渐变,举个简单的例子:他来了,她的脸渐渐红了...渐渐的,渐渐改变的,是不断在...2014-05-31
- 这篇文章主要介绍了使用pyecharts1.7进行简单的可视化大全,文中通过示例代码介绍的非常详细,对大家的学习或者工作具有一定的参考学习价值,需要的朋友们下面随着小编来一起学习学习吧...2020-05-18
- 本篇文章主要介绍了Vue2 使用 Echarts 创建图表实例代码,具有一定的参考价值,感兴趣的小伙伴们可以参考一下 ...2017-05-22
- 这篇文章主要介绍了解决Echarts 显示隐藏后宽度高度变小的问题,具有很好的参考价值,希望对大家有所帮助。一起跟随小编过来看看吧...2020-07-19
- 这篇文章主要给大家介绍了关于微信小程序使用Echarts和分包的完整步骤,文中通过示例代码介绍的非常详细,对大家的学习或者工作具有一定的参考学习价值,需要的朋友们下面随着小编来一起学习学习吧...2021-03-10
- 这篇文章主要介绍了实现ECharts双Y轴左右刻度线一致的例子,具有很好的参考价值,希望对大家有所帮助。一起跟随小编过来看看吧...2020-05-17
- 这篇文章主要介绍了基于Echarts 3.19 制作常用的图形(非静态)的相关资料,需要的朋友可以参考下...2016-05-20