matplotlib源码解析标题实现(窗口标题,标题,子图标题不同之间的差异)
在matplotlib中常用的标题主要三种:窗口标题、图像标题和子图标题。
先通过三个案例简要说明这三类标题的实现。
窗口标题、图像标题,子图标题(仅1个子图)
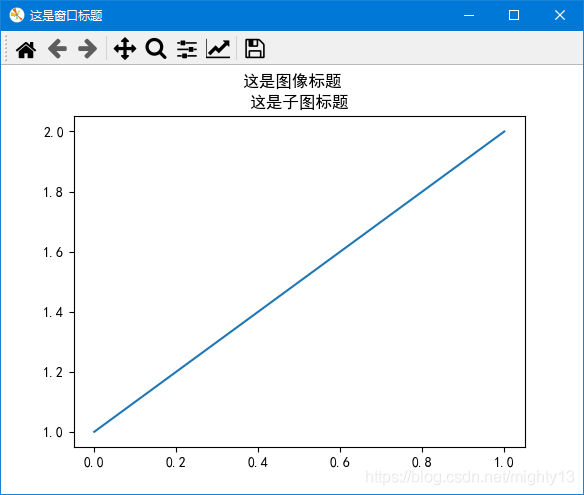
import matplotlib.pyplot as plt

plt.rcParams['font.sans-serif'] = 'SimHei'

fig = plt.figure()
plt.plot([1, 2])
# 设置图像标题
plt.suptitle("这是图像标题")
# 设置子图标题
plt.title("这是子图标题")
# 获取默认窗口标题
current_title = fig.canvas.manager.window.windowTitle()
print("默认窗口:",current_title)
# 设置窗口标题方式一
fig.canvas.set_window_title("这是窗口标题")
# 设置窗口标题方式二
fig.canvas.manager.window.setWindowTitle("这是窗口标题")

plt.show()
窗口标题、图像标题、子图标题(多子图)
使用subplot函数实现子图
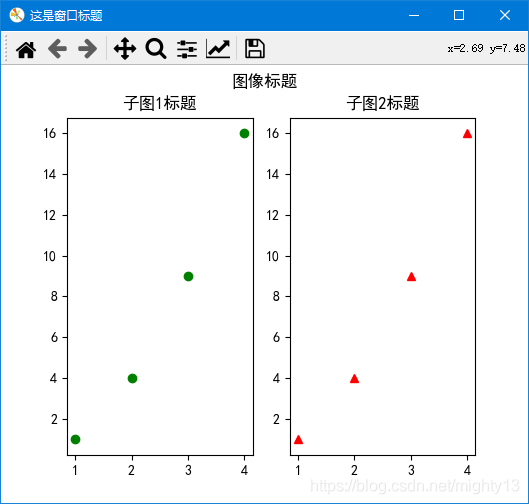
import matplotlib.pyplot as plt

plt.rcParams['font.sans-serif'] = 'SimHei'

fig = plt.figure()
plt.subplot(1, 2, 1)
plt.plot([1,2,3,4], [1,4,9,16], "go")
# 设置子图1标题
plt.title("子图1标题")

plt.subplot(122)
plt.plot([1,2,3,4], [1,4,9,16], "r^") # r^ 表示 红色(red)三角
# 设置子图2标题
plt.title("子图2标题")
# 设置图像标题
plt.suptitle("图像标题")
# 设置窗口标题
#fig.canvas.set_window_title("这是窗口标题")
fig.canvas.manager.window.setWindowTitle("这是窗口标题")

plt.show()
使用subplots函数subplots实现子图
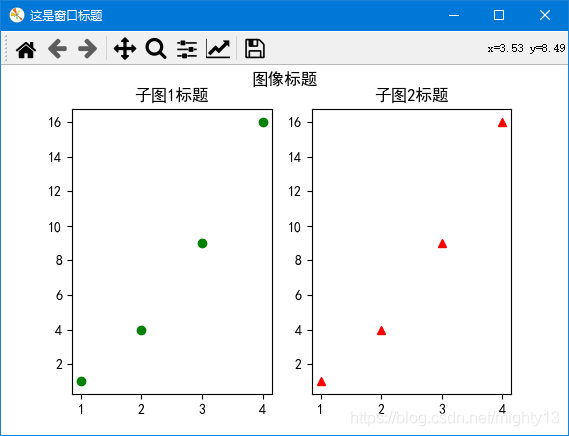
import matplotlib.pyplot as plt

plt.rcParams['font.sans-serif'] = 'SimHei'

fig, ax = plt.subplots(nrows=1, ncols=2, figsize=(6,6))
ax[0].plot([1,2,3,4], [1,4,9,16], "go")
# 设置子图1标题
ax[0].set_title("子图1标题")
ax[1].plot([1,2,3,4], [1,4,9,16], "r^")
# 设置子图2标题
ax[1].set_title("子图2标题")
# 设置图像标题
plt.suptitle("图像标题")
# 设置窗口标题
fig.canvas.manager.window.setWindowTitle("这是窗口标题")

plt.show()
原理分析
通过前面三个案例可知:
窗口标题
设置窗口标题可以用两种方法:
一种是调用figure.canvas对象的set_window_title方法,一种是figure.canvas.manager.window对象的setWindowTitle方法。通过下面源码可知,这两种方法其实是等价的。
因此在日常实现过程中,关键是获取当前图像对象(figure),即案例中的fig。该方法只有一个参数,类型为字符串。
可以通过
通过figure.canvas.manager.window对象的windowTitle方法可以获取窗口标题。
class FigureManagerQT(FigureManagerBase):
  def set_window_title(self, title):
    self.window.setWindowTitle(title)
图像标题
调用plt.suptitle函数即可。根据源码可知,plt.suptitle函数其实是调用了当前figure对象的suptitle方法。
suptitle函数参数
  def suptitle(self, t, **kwargs):
    """
    Add a centered title to the figure.

    Parameters
    ----------
    t : str
      The title text.

    x : float, default 0.5
      The x location of the text in figure coordinates.

    y : float, default 0.98
      The y location of the text in figure coordinates.

    horizontalalignment, ha : {'center', 'left', right'}, default: 'center'
      The horizontal alignment of the text relative to (*x*, *y*).

    verticalalignment, va : {'top', 'center', 'bottom', 'baseline'}, \
default: 'top'
      The vertical alignment of the text relative to (*x*, *y*).

    fontsize, size : default: :rc:`figure.titlesize`
      The font size of the text. See `.Text.set_size` for possible
      values.

    fontweight, weight : default: :rc:`figure.titleweight`
      The font weight of the text. See `.Text.set_weight` for possible
      values.

    Returns
    -------
    text
      The `.Text` instance of the title.

    Other Parameters
    ----------------
    fontproperties : None or dict, optional
      A dict of font properties. If *fontproperties* is given the
      default values for font size and weight are taken from the
      `.FontProperties` defaults. :rc:`figure.titlesize` and
      :rc:`figure.titleweight` are ignored in this case.

    **kwargs
      Additional kwargs are `matplotlib.text.Text` properties.

    Examples
    --------
    >>> fig.suptitle('This is the figure title', fontsize=12)
    """
子图标题
- 使用
subplot函数:在所在子图中,使用plt.title函数。 - 使用
subplots函数:使用子图对象调用set_title方法。 plt.title函数和axes.set_title方法的参数相同。
注意,在使用subplots函数创建子图时,为什么不能使用plt.title函数设置子图标题呢?
根据title函数的源码可知,title函数其实是通过gca()函数获取子图,然后再调用set_title方法设置标题的。根据实验,在使用subplots函数函数创建多个子图时,plt.gca()只能得到最后一个子图的标题,因此,在某些情况下使用plt.title函数可设置最后一个子图的标题。
plt.title函数和axes.set_title方法源码
def title(label, fontdict=None, loc=None, pad=None, *, y=None, **kwargs):
  return gca().set_title(
    label, fontdict=fontdict, loc=loc, pad=pad, y=y, **kwargs)
Axes.set_title(self, label, fontdict=None, loc=None, pad=None, *, y=None, **kwargs):
  """
  Set a title for the axes.

  Set one of the three available axes titles. The available titles
  are positioned above the axes in the center, flush with the left
  edge, and flush with the right edge.

  Parameters
  ----------
  label : str
    Text to use for the title

  fontdict : dict
    A dictionary controlling the appearance of the title text,
    the default *fontdict* is::

      {'fontsize': rcParams['axes.titlesize'],
      'fontweight': rcParams['axes.titleweight'],
      'color': rcParams['axes.titlecolor'],
      'verticalalignment': 'baseline',
      'horizontalalignment': loc}

  loc : {'center', 'left', 'right'}, default: :rc:`axes.titlelocation`
    Which title to set.

  y : float, default: :rc:`axes.titley`
    Vertical axes loation for the title (1.0 is the top). If
    None (the default), y is determined automatically to avoid
    decorators on the axes.

  pad : float, default: :rc:`axes.titlepad`
    The offset of the title from the top of the axes, in points.

  Returns
  -------
  `.Text`
    The matplotlib text instance representing the title

  Other Parameters
  ----------------
  **kwargs : `.Text` properties
    Other keyword arguments are text properties, see `.Text` for a list
    of valid text properties.
  """
plt.gca()实验
import matplotlib.pyplot as plt

plt.rcParams['font.sans-serif'] = 'SimHei'

fig, ax = plt.subplots(nrows=1, ncols=2, figsize=(6,6))
ax[0].plot([1,2,3,4], [1,4,9,16], "go")
ax[1].plot([1,2,3,4], [1,4,9,16], "r^")

print(plt.gca())
print(ax[0],ax[1])
结果为
AxesSubplot(0.547727,0.11;0.352273x0.77)
AxesSubplot(0.125,0.11;0.352273x0.77) AxesSubplot(0.547727,0.11;0.352273x0.77)
到此这篇关于matplotlib源码解析标题实现(窗口标题,标题,子图标题不同之间的差异)的文章就介绍到这了,更多相关matplotlib 标题内容请搜索猪先飞以前的文章或继续浏览下面的相关文章希望大家以后多多支持猪先飞!
相关文章
- 这篇文章主要介绍了matplotlib绘制正余弦曲线图的实现,文中通过示例代码介绍的非常详细,对大家的学习或者工作具有一定的参考学习价值,需要的朋友们下面随着小编来一起学习学习吧...2021-02-22
- 这篇文章主要介绍了matplotlib bar()实现百分比堆积柱状图,文中通过示例代码介绍的非常详细,对大家的学习或者工作具有一定的参考学习价值,需要的朋友们下面随着小编来一起学习学习吧...2021-02-24
python Matplotlib基础--如何添加文本和标注
这篇文章主要介绍了python Matplotlib基础--如何添加文本和标注,帮助大家更好的利用Matplotlib绘制图表,感兴趣的朋友可以了解下...2021-01-26matplotlib之pyplot模块之标题(title()和suptitle())
这篇文章主要介绍了matplotlib之pyplot模块之标题(title()和suptitle()),文中通过示例代码介绍的非常详细,对大家的学习或者工作具有一定的参考学习价值,需要的朋友们下面随着小编来一起学习学习吧...2021-02-23- 这篇文章主要介绍了vant 解决tab切换插件标题样式自定义的问题,具有很好的参考价值,希望对大家有所帮助。一起跟随小编过来看看吧...2020-11-14
- 这篇文章主要介绍了matplotlib grid()设置网格线外观的实现,文中通过示例代码介绍的非常详细,对大家的学习或者工作具有一定的参考学习价值,需要的朋友们下面随着小编来一起学习学习吧...2021-02-23
matplotlib之pyplot模块坐标轴标签设置使用(xlabel()、ylabel())
这篇文章主要介绍了matplotlib之pyplot模块坐标轴标签设置使用(xlabel()、ylabel()),文中通过示例代码介绍的非常详细,对大家的学习或者工作具有一定的参考学习价值,需要的朋友们下面随着小编来一起学习学习吧...2021-02-23- 这篇文章主要介绍了PyQt5结合matplotlib绘图的实现示例,文中通过示例代码介绍的非常详细,对大家的学习或者工作具有一定的参考学习价值,需要的朋友们下面随着小编来一起学习学习吧...2020-09-15
- 这篇文章主要介绍了将matplotlib绘图嵌入pyqt的方法示例,文中通过示例代码介绍的非常详细,对大家的学习或者工作具有一定的参考学习价值,需要的朋友们下面随着小编来一起学习学习吧...2020-04-27
- 这篇文章主要介绍了matplotlib subplot绘制多个子图的方法示例,文中通过示例代码介绍的非常详细,对大家的学习或者工作具有一定的参考学习价值,需要的朋友们下面随着小编来一起学习学习吧...2020-07-28
- 这篇文章主要介绍了matplotlib 三维图表绘制方法简介,文中通过示例代码介绍的非常详细,对大家的学习或者工作具有一定的参考学习价值,需要的朋友们下面随着小编来一起学习学习吧...2020-09-21
- 这篇文章主要介绍了用pip给python安装matplotlib库的详细教程,本文通过图文并茂的形式给大家介绍的非常详细,对大家的学习或工作具有一定的参考借鉴价值,需要的朋友可以参考下...2021-02-25
- 这篇文章主要介绍了如何在 Matplotlib 中更改绘图背景的实现,文中通过示例代码介绍的非常详细,对大家的学习或者工作具有一定的参考学习价值,需要的朋友们下面随着小编来一起学习学习吧...2020-11-26
- 这篇文章主要介绍了使用matplotlib的pyplot模块绘图的实现示例,文中通过示例代码介绍的非常详细,对大家的学习或者工作具有一定的参考学习价值,需要的朋友们下面随着小编来一起学习学习吧...2020-07-12
- 这篇文章主要介绍了python 如何在 Matplotlib 中绘制垂直线,帮助大家更好的理解和学习使用python,感兴趣的朋友可以了解下...2021-04-03
matplotlib 多个图像共用一个colorbar的实现示例
这篇文章主要介绍了matplotlib 多个图像共用一个colorbar的实现示例,文中通过示例代码介绍的非常详细,对大家的学习或者工作具有一定的参考学习价值,需要的朋友们下面随着小编来一起学习学习吧...2020-09-10- 这篇文章主要介绍了python Matplotlib模块的使用,帮助大家更好的利用python处理图像,感兴趣的朋友可以了解下...2020-09-16
- 这篇文章主要介绍了Matplotlib绘制雷达图和三维图的示例代码,文中通过示例代码介绍的非常详细,对大家的学习或者工作具有一定的参考学习价值,需要的朋友们下面随着小编来一起学习学习吧...2020-04-30
- 这篇文章主要介绍了完美解决matplotlib子图坐标轴重叠问题,具有很好的参考价值,希望对大家有所帮助。一起跟随小编过来看看吧...2021-04-16
C#利用Label标签控件模拟窗体标题的移动及窗体颜色不断变换效果
Label标签控件相信对大家来说都不陌生,下面这篇文章主要给大家介绍了关于C#利用Label标签控件模拟窗体标题的移动及窗体颜色不断变换效果的相关资料,文中通过示例代码介绍的非常详细,需要的朋友可以参考下。...2020-06-25