python 生成正态分布数据,并绘图和解析
更新时间:2020年12月21日 20:10 点击:2400
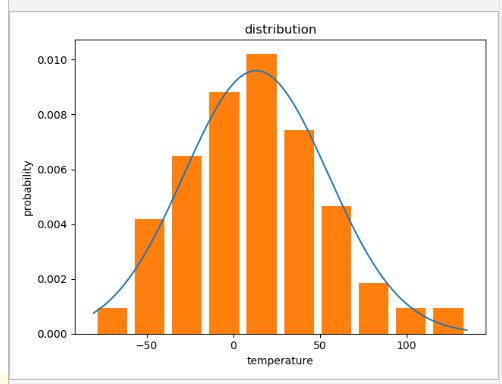
1、生成正态分布数据并绘制概率分布图
import pandas as pd
import numpy as np
import matplotlib.pyplot as plt


# 根据均值、标准差,求指定范围的正态分布概率值
def normfun(x, mu, sigma):
  pdf = np.exp(-((x - mu)**2)/(2*sigma**2)) / (sigma * np.sqrt(2*np.pi))
  return pdf


# result = np.random.randint(-65, 80, size=100) # 最小值,最大值,数量
result = np.random.normal(15, 44, 100) # 均值为0.5,方差为1
print(result)

x = np.arange(min(result), max(result), 0.1)
# 设定 y 轴,载入刚才的正态分布函数
print(result.mean(), result.std())
y = normfun(x, result.mean(), result.std())
plt.plot(x, y) # 这里画出理论的正态分布概率曲线

# 这里画出实际的参数概率与取值关系
plt.hist(result, bins=10, rwidth=0.8, density=True) # bins个柱状图,宽度是rwidth(0~1),=1没有缝隙
plt.title('distribution')
plt.xlabel('temperature')
plt.ylabel('probability')
# 输出
plt.show() # 最后图片的概率和不为1是因为正态分布是从负无穷到正无穷,这里指截取了数据最小值到最大值的分布
根据范围生成正态分布:
result = np.random.randint(-65, 80, size=100) # 最小值,最大值,数量
根据均值、方差生成正态分布:
result = np.random.normal(15, 44, 100) # 均值为0.5,方差为1
2、判断一个序列是否符合正态分布
import numpy as np
from scipy import stats


pts = 1000
np.random.seed(28041990)
a = np.random.normal(0, 1, size=pts) # 生成1个正态分布,均值为0,标准差为1,100个点
b = np.random.normal(2, 1, size=pts) # 生成1个正态分布,均值为2,标准差为1, 100个点
x = np.concatenate((a, b)) # 把两个正态分布连接起来,所以理论上变成了非正态分布序列
k2, p = stats.normaltest(x)
alpha = 1e-3
print("p = {:g}".format(p))


# 原假设:x是一个正态分布
if p < alpha: # null hypothesis: x comes from a normal distribution
  print("The null hypothesis can be rejected") # 原假设可被拒绝,即不是正态分布
else:
  print("The null hypothesis cannot be rejected") # 原假设不可被拒绝,即使正态分布
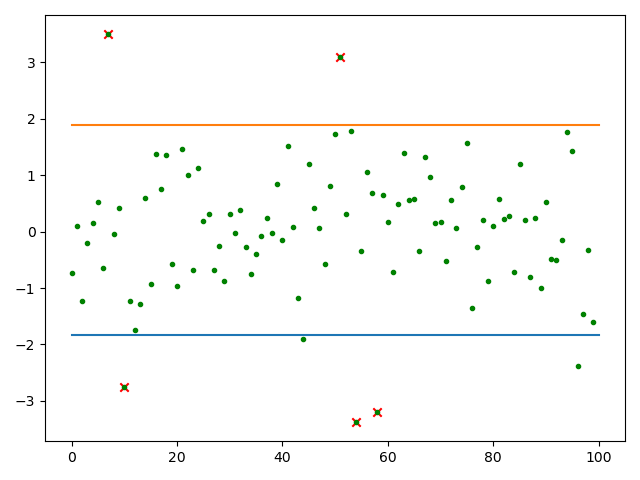
3、求置信区间、异常值
import numpy as np
import matplotlib.pyplot as plt
from scipy import stats
import pandas as pd


# 求列表数据的异常点
def get_outer_data(data_list):
  df = pd.DataFrame(data_list, columns=['value'])
  df = df.iloc[:, 0]
  # 计算下四分位数和上四分位
  Q1 = df.quantile(q=0.25)
  Q3 = df.quantile(q=0.75)

  # 基于1.5倍的四分位差计算上下须对应的值
  low_whisker = Q1 - 1.5 * (Q3 - Q1)
  up_whisker = Q3 + 1.5 * (Q3 - Q1)

  # 寻找异常点
  kk = df[(df > up_whisker) | (df < low_whisker)]
  data1 = pd.DataFrame({'id': kk.index, '异常值': kk})
  return data1


N = 100
result = np.random.normal(0, 1, N)
# result = np.random.randint(-65, 80, size=N) # 最小值,最大值,数量
mean, std = result.mean(), result.std(ddof=1) # 求均值和标准差

# 计算置信区间,这里的0.9是置信水平
conf_intveral = stats.norm.interval(0.9, loc=mean, scale=std) # 90%概率
print('置信区间:', conf_intveral)

x = np.arange(0, len(result), 1)

# 求异常值
outer = get_outer_data(result)
print(outer, type(outer))
x1 = outer.iloc[:, 0]
y1 = outer.iloc[:, 1]
plt.scatter(x1, y1, marker='x', color='r') # 所有离散点
plt.scatter(x, result, marker='.', color='g') # 异常点
plt.plot([0, len(result)], [conf_intveral[0], conf_intveral[0]])
plt.plot([0, len(result)], [conf_intveral[1], conf_intveral[1]])
plt.show()
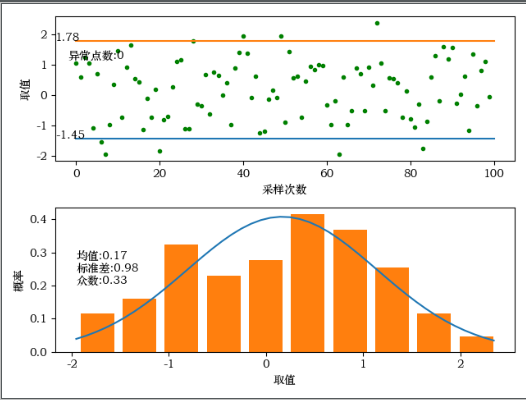
4、采样点离散图和概率图
import numpy as np
import matplotlib.pyplot as plt
from scipy import stats
import pandas as pd
import time


print(time.strftime('%Y-%m-%D %H:%M:%S'))


# 根据均值、标准差,求指定范围的正态分布概率值
def _normfun(x, mu, sigma):
  pdf = np.exp(-((x - mu)**2)/(2*sigma**2)) / (sigma * np.sqrt(2*np.pi))
  return pdf


# 求列表数据的异常点
def get_outer_data(data_list):
  df = pd.DataFrame(data_list, columns=['value'])
  df = df.iloc[:, 0]
  # 计算下四分位数和上四分位
  Q1 = df.quantile(q=0.25)
  Q3 = df.quantile(q=0.75)

  # 基于1.5倍的四分位差计算上下须对应的值
  low_whisker = Q1 - 1.5 * (Q3 - Q1)
  up_whisker = Q3 + 1.5 * (Q3 - Q1)

  # 寻找异常点
  kk = df[(df > up_whisker) | (df < low_whisker)]
  data1 = pd.DataFrame({'id': kk.index, '异常值': kk})
  return data1


N = 100
result = np.random.normal(0, 1, N)
# result = np.random.randint(-65, 80, size=N) # 最小值,最大值,数量
# result = [100]*100 # 取值全相同
# result = np.array(result)
mean, std = result.mean(), result.std(ddof=1) # 求均值和标准差
# 计算置信区间,这里的0.9是置信水平
if std == 0: # 如果所有值都相同即标准差为0则无法计算置信区间
  conf_intveral = [min(result)-1, max(result)+1]
else:
  conf_intveral = stats.norm.interval(0.9, loc=mean, scale=std) # 90%概率
# print('置信区间:', conf_intveral)
# 求异常值
outer = get_outer_data(result)
# 绘制离散图
fig = plt.figure()
fig.add_subplot(2, 1, 1)
plt.subplots_adjust(hspace=0.3)
x = np.arange(0, len(result), 1)
plt.scatter(x, result, marker='.', color='g') # 画所有离散点
plt.scatter(outer.iloc[:, 0], outer.iloc[:, 1], marker='x', color='r') # 画异常离散点
plt.plot([0, len(result)], [conf_intveral[0], conf_intveral[0]]) # 置信区间线条
plt.plot([0, len(result)], [conf_intveral[1], conf_intveral[1]]) # 置信区间线条
plt.text(0, conf_intveral[0], '{:.2f}'.format(conf_intveral[0])) # 置信区间数字显示
plt.text(0, conf_intveral[1], '{:.2f}'.format(conf_intveral[1])) # 置信区间数字显示
info = 'outer count:{}'.format(len(outer.iloc[:, 0]))
plt.text(min(x), max(result)-((max(result)-min(result)) / 2), info) # 异常点数显示
plt.xlabel('sample count')
plt.ylabel('value')
# 绘制概率图
if std != 0: # 如果所有取值都相同
  fig.add_subplot(2, 1, 2)
  x = np.arange(min(result), max(result), 0.1)
  y = _normfun(x, result.mean(), result.std())
  plt.plot(x, y) # 这里画出理论的正态分布概率曲线
  plt.hist(result, bins=10, rwidth=0.8, density=True) # bins个柱状图,宽度是rwidth(0~1),=1没有缝隙
  info = 'mean:{:.2f}\nstd:{:.2f}\nmode num:{:.2f}'.format(mean, std, np.median(result))
  plt.text(min(x), max(y) / 2, info)
  plt.xlabel('value')
  plt.ylabel('Probability')
else:
  fig.add_subplot(2, 1, 2)
  info = 'non-normal distribution!!\nmean:{:.2f}\nstd:{:.2f}\nmode num:{:.2f}'.format(mean, std, np.median(result))
  plt.text(0.5, 0.5, info)
  plt.xlabel('value')
  plt.ylabel('Probability')
plt.savefig('./distribution.jpg')
plt.show()

print(time.strftime('%Y-%m-%D %H:%M:%S'))
以上就是python 生成正态分布数据,并绘图和解析的详细内容,更多关于python 正态分布的资料请关注猪先飞其它相关文章!
相关文章
- 这篇文章主要介绍了python-opencv-画外接矩形框的实例代码,代码简单易懂,对大家的学习或工作具有一定的参考借鉴价值,需要的朋友可以参考下...2021-09-04
Python astype(np.float)函数使用方法解析
这篇文章主要介绍了Python astype(np.float)函数使用方法解析,文中通过示例代码介绍的非常详细,对大家的学习或者工作具有一定的参考学习价值,需要的朋友可以参考下...2020-06-08- 2022虎年新年即将来临,小编为大家带来了一个利用Python编写的虎年烟花特效,堪称全网最绚烂,文中的示例代码简洁易懂,感兴趣的同学可以动手试一试...2022-02-14
- 在本篇文章里小编给大家分享的是一篇关于python中numpy.empty()函数实例讲解内容,对此有兴趣的朋友们可以学习下。...2021-02-06
python-for x in range的用法(注意要点、细节)
这篇文章主要介绍了python-for x in range的用法,具有很好的参考价值,希望对大家有所帮助。一起跟随小编过来看看吧...2021-05-10- 这篇文章主要介绍了Python 图片转数组,二进制互转操作,具有很好的参考价值,希望对大家有所帮助。一起跟随小编过来看看吧...2021-03-09
- 这篇文章主要介绍了Python中的imread()函数用法说明,具有很好的参考价值,希望对大家有所帮助。一起跟随小编过来看看吧...2021-03-16
- 这篇文章主要介绍了python如何实现b站直播自动发送弹幕,帮助大家更好的理解和学习使用python,感兴趣的朋友可以了解下...2021-02-20
python Matplotlib基础--如何添加文本和标注
这篇文章主要介绍了python Matplotlib基础--如何添加文本和标注,帮助大家更好的利用Matplotlib绘制图表,感兴趣的朋友可以了解下...2021-01-26- 这篇文章主要介绍了解决python 使用openpyxl读写大文件的坑,具有很好的参考价值,希望对大家有所帮助。一起跟随小编过来看看吧...2021-03-13
- 今天小编就为大家分享一篇python 计算方位角实例(根据两点的坐标计算),具有很好的参考价值,希望对大家有所帮助。一起跟随小编过来看看吧...2020-04-27
- 在本篇文章里小编给大家整理的是一篇关于python中使用np.delete()的实例方法,对此有兴趣的朋友们可以学习参考下。...2021-02-01
- 这篇文章主要为大家详细介绍了python实现双色球随机选号,文中示例代码介绍的非常详细,具有一定的参考价值,感兴趣的小伙伴们可以参考一下...2020-05-02
- 这篇文章主要介绍了使用Python的pencolor函数实现渐变色功能,本文通过实例代码给大家介绍的非常详细,对大家的学习或工作具有一定的参考借鉴价值,需要的朋友可以参考下...2021-03-09
Python getsizeof()和getsize()区分详解
这篇文章主要介绍了Python getsizeof()和getsize()区分详解,文中通过示例代码介绍的非常详细,对大家的学习或者工作具有一定的参考学习价值,需要的朋友们下面随着小编来一起学习学习吧...2020-11-20- 这篇文章主要介绍了python自动化办公操作PPT的实现,文中通过示例代码介绍的非常详细,对大家的学习或者工作具有一定的参考学习价值,需要的朋友们下面随着小编来一起学习学习吧...2021-02-05
- 这篇文章主要介绍了解决python 两个时间戳相减出现结果错误的问题,具有很好的参考价值,希望对大家有所帮助。一起跟随小编过来看看吧...2021-03-12
- 这篇文章主要为大家详细介绍了python实现学生通讯录管理系统,文中示例代码介绍的非常详细,具有一定的参考价值,感兴趣的小伙伴们可以参考一下...2021-02-25
- 这篇文章主要介绍了PyTorch一小时掌握之迁移学习篇,本文给大家介绍的非常详细,对大家的学习或工作具有一定的参考借鉴价值,需要的朋友可以参考下...2021-09-08
- 这篇文章主要介绍了Python绘制的爱心树与表白代码,本文通过实例代码给大家介绍的非常详细,对大家的学习或工作具有一定的参考借鉴价值,需要的朋友可以参考下...2021-04-06